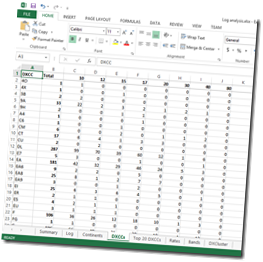
 One of the things I like to do shortly after a DXpedition is to do some fairly detailed statistical analysis on my log. This helps highlight openings or areas of the world I might have missed, and helps me consider improvements for the next trip. It can also help identify where propagation predictions did, and didn’t, match reality.
This time, I’ve decided to share my analysis here.
Over the week, between four of us operating fairly leisurely, we made just under 16,000 QSOs, of which I made 3320.
Mode and band choice
As a team, we’d decided before the DXpedition to focus on the WARC bands, because VP9 is often activated in contests. Due to the 150W limit in VP9, most of the others had also decided to concentrate on CW, but I wanted to maintain about a 50:50 balance of CW and SSB.
As indicated in the graph below, I broadly achieved that balance on the higher bands, but conditions just didn’t permit CW on 40m and 80m. Moreover, with the higher bands performing so well, I was able to take advantage of the conditions on 10m and 15m, even though that meant slightly less WARC activity than I had planned.
Rates
VP9 is also not a rare DXCC, so we weren’t aiming for particularly high rates on this trip. We’d wanted to have the opportunity to do plenty of tourism while we were there, too, so we were expecting to have some days with less activity than others. Luckily, we also knew that propagation around midday could be difficult on several bands, so this would give us the opportunity to go out and see more of the island.
The graph of QSOs / hour reflects this, but I still managed to approach 140 contacts per hour a couple of times, despite this relaxed operation.
It is also interesting that the number of spots per hour roughly tracks the number of QSOs I was making (I‘m not sure whether this is cause or effect; I suspect a bit of both)
Perhaps more notable is the rate that was achievable on each band. 12m was far the most open band in these terms, which is rather a surprise, particularly when compared to 10m. Obviously the idea of concentrating on WARC bands wasn’t a bad idea. (This graph is slightly misleading in that it doesn’t take into account when I was operating and on several occasions my role was to make the last few QSOs as the band closed, while the others operated on more productive wavelengths.)
Geographic spread
I’m rather surprised to see how skewed towards Europe my log is; it certainly felt as though I was making many more contacts to North America. It’s pleasing that there is a small number of Asian stations in there too, however. This was mainly contributed by some reasonable runs into Japan on a slightly difficult auroral greyline path over the Arctic.
This data becomes more interesting when analysed per band, however. Whilst Europe dominated on 10m and 12m, the Europe : North America balance was more even from 17m downwards (and, indeed, North America was the source of a majority of my QSOs in 30m).
The lack of Asian stations on 12m is mainly because Martin G3ZAY operated on that band during the greyline openings.
I’m slightly surprised there aren’t more African stations in the log. It should have been an easy path but we just didn’t have many callers from there.
The top 20 DXCCs to call me were more-or-less as expected but, being patriotic, it’s great to see so G (England) so high in the list:
|
DXCC |
Total QSOs |
% QSOs |
| K | 987 | 30% |
| DL | 287 | 9% |
| I | 284 | 9% |
| G | 196 | 6% |
| EA | 181 | 5% |
| SP | 136 | 4% |
| F | 106 | 3% |
| UA | 101 | 3% |
| VE | 101 | 3% |
| JA | 88 | 3% |
| UR | 73 | 2% |
| PA | 66 | 2% |
| ON | 61 | 2% |
| OK | 60 | 2% |
| SM | 41 | 1% |
| S5 | 36 | 1% |
| 9A | 33 | 1% |
| OM | 33 | 1% |
| OE | 26 | 1% |
| OH | 26 | 1% |
Anything else?
Is there anything else you’d like to learn from my log? If so, feel free to add a comment. For those who are interested, this is simply a CSV export from Win-Test into Excel, so I can easily analyse any other factors Win-Test can export.


